If your child needs math practice, click here.
For sample problems, click here.
Here are some tips for Line Graphs, which aligns with Texas state standards:
Line Graphs
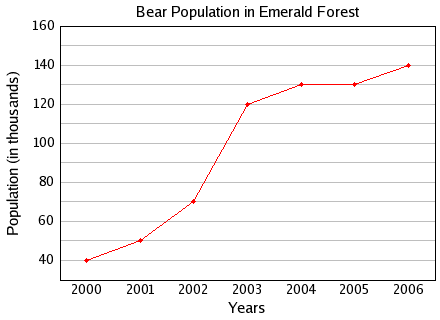
A line graph shows change over time.
The data is connected by lines, like dot-to-dot or connect-the-dots.
The x-axis (horizontal) usually has the time, increasing from left to right.
The y-axis (vertical) usually has the numbers that measure what is changing over time.
| |
| The bear population in the Emerald Forest increased over time. |
Copyright Accurate Learning Systems Corporation 2008.
MathScore is a registered trademark.