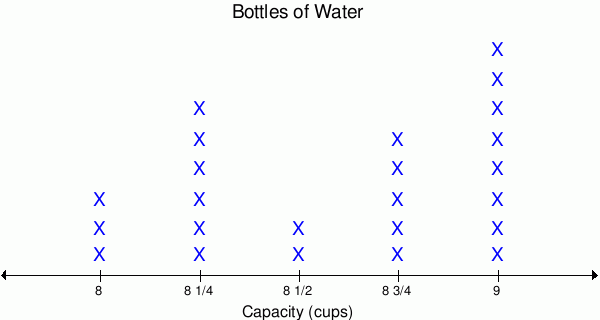
Math Practice Topic: Line Plots 2

Description: Interpret data presented in line plots. The scale may be halves, quarters, or eighths.

Adaptive Learning Progression: The line plot becomes more complex.

Sample Levels (out of 4)
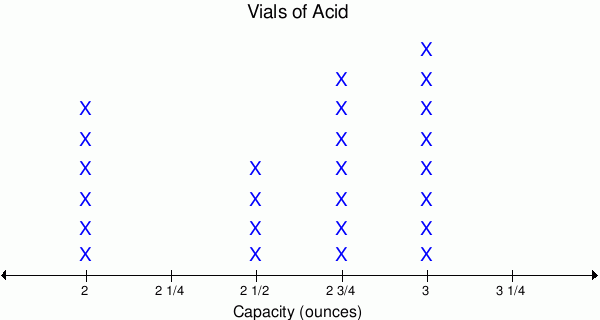
1.
How many bottles hold more than 8 1/2 cups?


2.
What is the smallest value measured?
                                       

3.
There is a new bottle that holds 8 2/5 cups. How much
more can the new bottle hold than the smallest bottle?

cups


1.
What is the smallest value measured?
                                               

2.
What is the biggest value measured?
                                               

3.
There is a new vial that holds 1/2 ounce more than the
largest vial. How much can the new vial hold?

ounces


4.
There is a new vial that holds 2 1/6 ounces. How much
more can the new vial hold than the smallest vial?

ounces


5.
How many vials hold more than 2 3/4 ounces?


6.
What is the difference in capacity between the biggest and
smallest vials?

ounces


About Us | FAQ | Contact Us | Sales Opportunities | Terms of Use | Privacy Policy


About Us | FAQ | Contact Us | Sales Opportunities | Terms of Use | Privacy Policy